Originally published in Econosseur.
The True Benefits and Costs of Data Centers in the US
Summary
- Data centers should be assessed based on their benefits relative to their costs, including externalities imposed on other businesses and residents. And data centers should be evaluated by the same criteria as all other businesses and investments across industries.
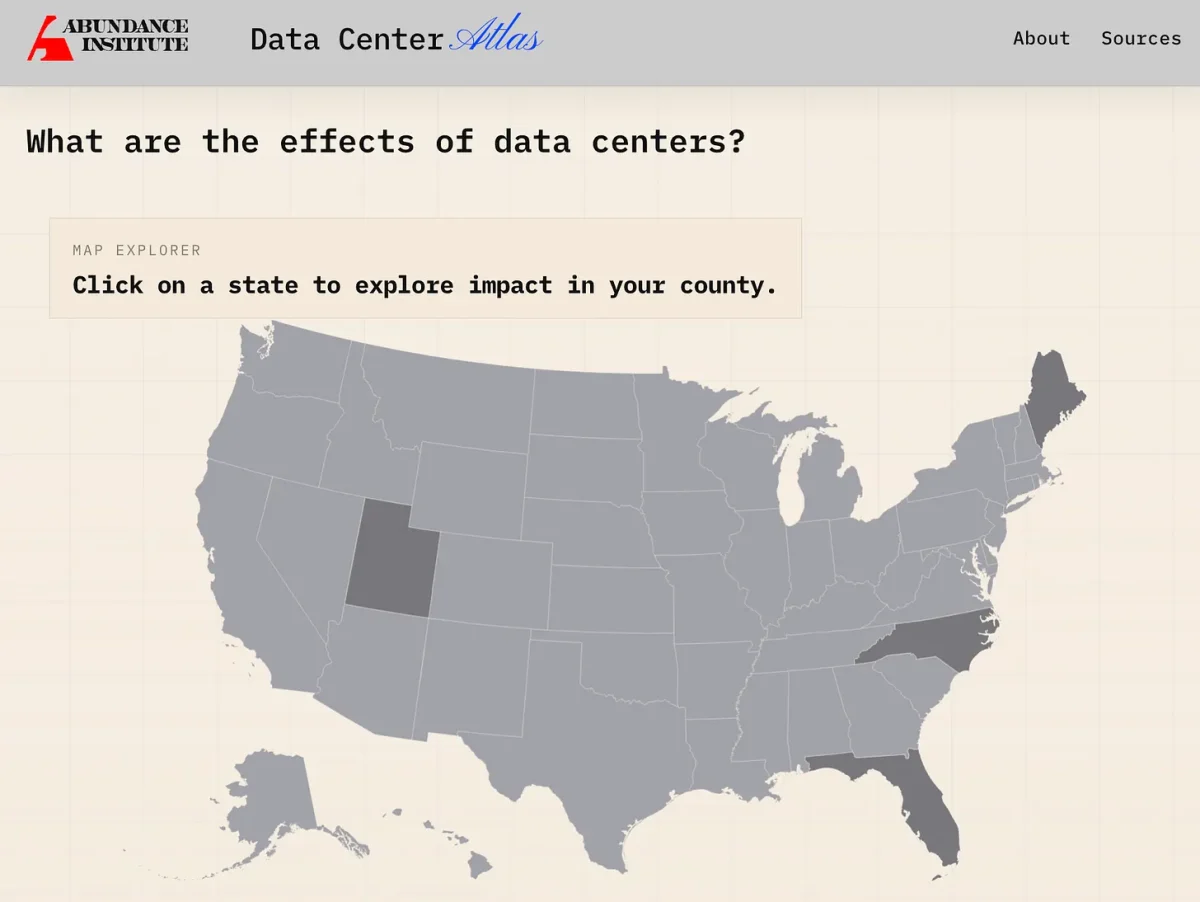
- The DataCenterAtlas.org web tool provides a transparent, county-level tool that allows policymakers, local officials, and residents to compare the economic benefits, tax revenues, electricity demand, water use, and employment effects of data centers using publicly available data.
- Property tax revenue from data centers can be sizable to counties and municipalities, even when significant tax exemptions are granted.
- Data center water and electricity use are significant, but declining. And current data center water and electricity use are comparable to or lower than many other common uses across industries.
Figure 1. Screenshot of www.DataCenterAtlas.org
1. Introduction
“The AI breakout is supercharging an already booming data center industry, with estimates that US data center investments will exceed $1 trillion over the next five years. Even this may not be enough: one industry estimate suggests that the largest players in the industry—the so-called ‘hyperscalers’—will need to deploy an additional $1.8 trillion in capital by 2030 to keep up with demand. These investments are coming. The only question is where they are located, and state tax policy choices can play a meaningful role in that decision.” (Jared Walczak. See Walczak, 2025; Martin, et al, 2025; Lee, et al, 2025)
Data centers are the current engine of tech hot takes. Across the country, local planning boards, state legislatures, and even federal agencies are being asked to make consequential decisions about whether and how to allow new data center development.1 Unfortunately, those decisions are increasingly being shaped by a mix of outdated assumptions, cherry-picked statistics, and outright misinformation.2
This article has a simple purpose to lay out the facts on data centers–on both the costs and the benefits. We want to provide a grounded look at what data centers actually do, what they cost, and what false claims to watch out for. We also introduce our tool, DataCenterAtlas.org, that demonstrates these benefits and costs for different sized data centers in different US counties.
The DataCenterAtlas.org app allows you to choose a state and a county within that state and calculate the estimated property tax revenue to that county from a data center of a given size.3 You can see how the property tax revenue from the data center changes as you change the size of the data center and the degree of tax incentives. You can then explore how that data center compares in electricity consumption, water consumption, and employment to other common industries.
Data centers power hospital and banking services, weather forecasts, most of the internet, and AI applications. It is true that data centers use water and electricity, take up space, can make noise, and emit heat. Our goal in this article is to document the true costs and benefits of data centers so local residents and officials can make the most informed decisions about data centers in their areas.
Data centers should be judged by the same metrics and requirements as other industries. What are the technologies enabled by data centers, and are we willing to give them up? What are the tradeoffs? Essential technologies are often initially faced with fear and uncertainty, such as electricity, cars, and the radio.
Other good articles in this space highlighting the benefits of data centers and the way to overcome any relevant resource constraints include Loesel and Smith (2025), Springman and Beard (2026), and Barkley and Edmonds (2026).
2. What Data Centers Do
Long before data centers were the workhorses of the AI arms race, these computational factories were providing the backbone of the IT services our cultures and economies have come to depend on. Since the 1940’s, they have been storing, processing, and transmitting data. Data centers predate barcodes, credit cards, and even velcro.
Here are some examples of what is currently running through data centers every day:
- Cloud computing services (business operations running on services like Amazon Web Services, Microsoft Azure, Google Cloud)
- Financial transactions (banks, credit cards, trading platforms)
- Healthcare systems (electronic medical records, imaging storage, telemedicine)
- Government services (tax filing, social services, public safety systems)
- Telecommunications and internet traffic (email, video calls, messaging, browsing)
- Streaming and content delivery (Netflix, YouTube, Spotify)
- Enterprise software (Enterprise resource planning systems, logistics, supply chains)
- Scientific computing (climate models, genomics, national labs)
- AI training and inference (ChatGPT, Claude, Gemini, Grok, AlphaFold, etc)
Different data centers provide different services to the general compute infrastructure. But if you removed data centers tomorrow, you wouldn’t just lose chatbots. You would lose payroll systems, hospital records, logistics networks, and most of the modern economy. Put differently, data centers are to the digital economy what roads, ports, and factories are to the physical one.
3. Data Center Equivalences
Data centers are not a new industry. The first data centers in the US were built in the 1940s and housed the first mainframe computers.4 Over the years, their use cases have broadened in scope and in intensity. In our tool, we equate data center water use and electricity use to those of more familiar industries, like golf courses and grocery stores.
3.1. Property tax revenue to counties and municipalities
In addition to state sales tax, state corporate income tax, and federal corporate income tax, data centers provide significant property tax revenue to the counties where they are located.5 Loudoun County, Virginia, boasts the highest concentration of data centers in the country—200 data facilities, 50 million square feet—with specific zoning ordinances and tax incentives to facilitate entrants. The data centers in Loudoun County generate almost half of the county’s tax revenue.6 In the words of Loudoun County’s chief of economic development, Buddy Rizer:
“The reason Loudoun, and now other places, wanted data centers is clear. Rizer noted that the centers ‘provide tax revenue, and they don’t put a drain on services. It’s really a perfect industry for a fast-growing community like ours.’” (Buddy Rizer, Loudoun County, Virginia, Chief of Economic Development. See Glock, 2026 and Verge, 2014)
Not only do property tax rates vary within counties and sometimes across types of businesses, but data centers also often enjoy some degree of tax exemption on their property taxes.7 Despite these exemptions, data centers are a significant source of revenue to the county and municipal revenues where they are located.
In our DataCenterAtlas.org tool, you can choose a data center of a given size—ranging from 0.9 megawatts (MW) to 2.0 gigawatts (GW; 1 GW = 1,000 MW). We used a dataset of publicly available data center sizes and data center valuations to estimate the relationship between data center electrical capacity as a measure of size and its market valuation.8 We then use this market valuation with the average effective property tax rate in each county, including the percent of property tax exemption for that county, in order to calculate the estimated property tax revenue from the data center.
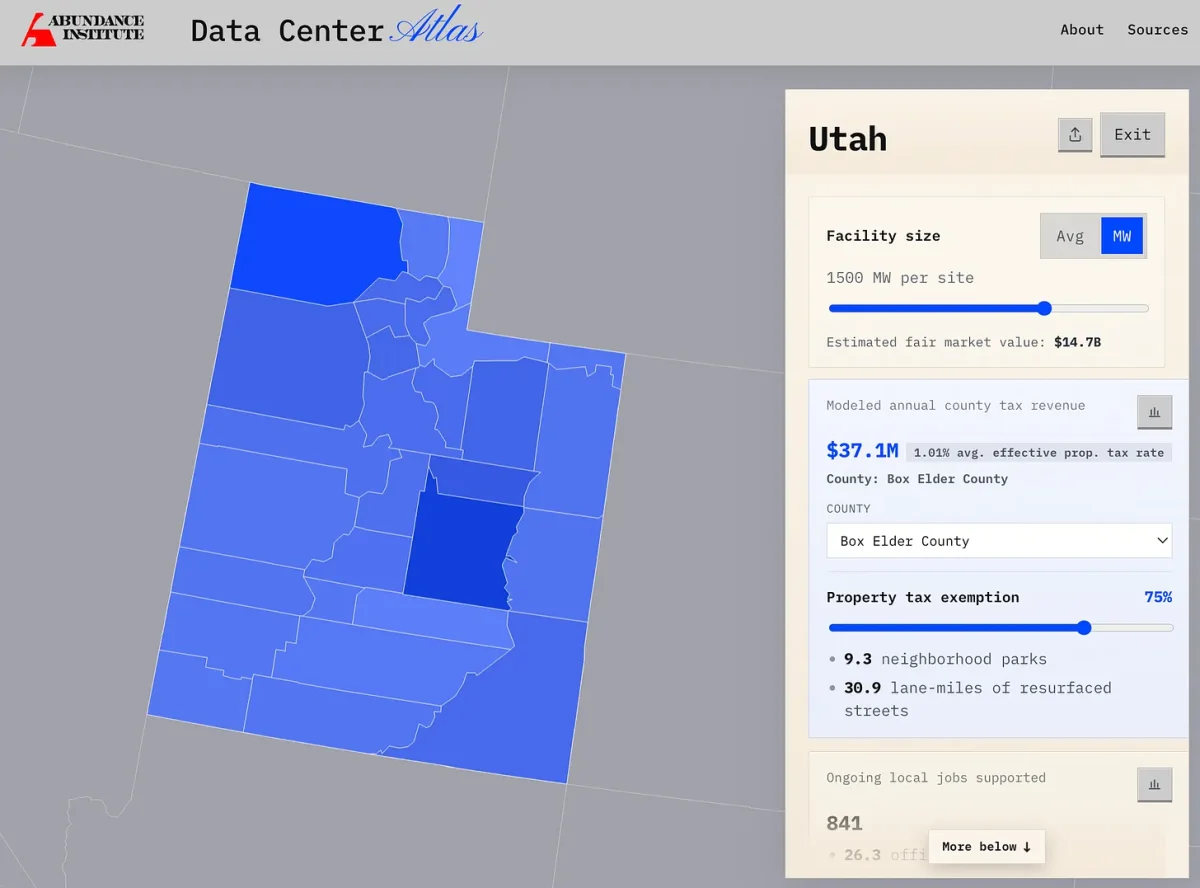
There has been a lot of recent debate, and some protests, around the proposed construction of a 1.5 GW data center in Box Elder County in northern Utah.9 A 1.5 GW data center in Box Elder County, Utah would have an estimated fair market value of $14.7 billion. And with a 75% property tax exemption, would still bring in $37.1 million in property tax revenue every year to the county. That is 49% of the 2025 total budget for Box Elder County.10
3.2. New power demand
Peak electricity usage capacity is a valuable metric of the resources consumed by data centers and of their size. We compare this to the new power demand of other large-scale industrial or commercial facilities, such as factory complexes or pumping plants. Primary aluminum smelters consume on average 889 MW of continuous power, and the Edmonston, CA pumping plant runs up to 835 MW.11 Like data centers, these facilities are power hungry and provide essential services.
In our example of a 1.5 GW data center in Box Elder County, the DataCenterAtlas.org tool shows that this data center’s electricity usage would be 9.86 TWh/year—equivalent to 1.3 primary aluminum smelters or to 11 large factory complexes. This size data center would require significant electrical capacity resources.12
The good news on the electrical front is that capacity is increasing across all electricity production methods: nuclear, coal, natural gas, geothermal, wind, solar, and hydroelectric. Some states are experiencing an energy renaissance, with new nuclear reactors coming online in Utah and Idaho by July 2026.13 The Abundance Institute’s 2026 Annual Gala in association with the Operation Gigawatt Summit in May 2026 brought politicians, policy makers, and private sector builders together to discuss electrical capacity and its necessity for sustaining progress.14
A recent study by Ryu and Hiatt at the University of Southern California Marshall Zage Business of Energy Initiative finds that new data centers drive up wholesale energy prices by a small amount among electric cooperatives and municipalities, but have almost no effect on the investor owned wholesale market utilities, which make up 68% of the wholesale market. Further, they find that new data centers have no significant effect on retail consumer electricity prices.15
3.3. Cooling water
The two most scarce resources that data centers use are electricity and water. In our assessment of data center water usage, we make a conservative assumption, which we detail below. However, this conservative assumption reflects the current average water usage of data centers in operation today rather than those currently being built or in the planning phases. As such, we are providing an upper bound of the water that new data centers will use now in the future.
A Department of Energy report from the Energy Analysis and Environmental Impacts Division (Shehabi, et al, 2024) estimated that average data center cooling water usage efficiency is 0.45-0.48 L/kWh (liters per kilowatt hour) or 450-480 L/MWh (liters per megawatt hour). However, more recent advances in data center cooling suggest that newly constructed data centers will be more in the 0.15-0.25 L/kWh range.16 We assume a water usage efficiency (WUE) for new data centers at a conservative 0.2 L/kWh. This estimate is conservative because most systems being constructed now have closed loop liquid cooling, which can have much lower WUE than 0.2 L/kWh.
Our assumption of WUE of 0.2 L/kWh for new data centers results in an estimate that the 1.5 GW data center proposed in Box Elder County, Utah, would use 521 million gallons of water per year for its cooling. This would be equivalent to the water usage of 13.2 golf courses.17 The initial water application for this data center was for 1,900 acre-feet of water per year (619 million gallons) from the Salt Wells Spring Stream.18
General non-data-center Industrial facilities can consume much more water per year, such as the retired Paducah Gaseous Diffusion Plant (uranium enrichment), which consumed nearly 9 billion gallons of water per year.19 And the US Steel Granite City Works in Illinois used 5.8 billion gallons per year.20 And, as mentioned above, a modern data center is likely to use a closed loop liquid cooling system that uses much less water than our 0.2 L/kWh assumption.
3.4. Construction phase and ongoing local jobs supported
During construction, large data centers will have as many as 1,688 employees, primarily working on construction of the facility for 18-to-24 months. After the construction phase, data centers have relatively low labor demands. The typical large data center will support 157 ongoing jobs to maintain the facility.21 A large supermarket will have around between 100-200 full-time and part-time employees.22 More industrial facilities such as the US Steel Granite City Works have about 1,300 employees.23
4. Conclusion
Data centers are not a passing trend. Rather, they are the continuation and direct outgrowth of the computing, information technology, and internet revolutions that began in the 1940s. They are foundational infrastructure for a modern economy that runs on data and computation.
This does not mean that data centers are costless. They use power, water, and land. But so does almost every form of economic activity. The relevant question is not whether data centers have costs. The correct approach is to assess every industry’s benefits minus the costs including any externalities imposed on other businesses and residents.
If data centers were evaluated using the same criteria of other industries, with accurate information about their true costs and true benefits, we would likely see less opposition and a better mix of investment and development that promote the biggest advances in our standard of living.
Appendix
Methodology for calculating data center estimated property tax revenue
In the DataCenterAtlas.org tool, we let the user choose a state, then choose a county in that state with a data center size in terms of electrical capacity.
Figure 2. Screenshot of www.DataCenterAtlas.org state page for Utah with data center facility size
The formula for calculating the state revenue from a data center of a given size is the following:

In most cases, the effective property tax rate is equivalent to the statutory property tax rate, or the officially posted property tax rate. These rates are sometimes posted as percent of assessed value (a property tax rate) and are sometimes posted as mill rates or the dollars per $1,000 of assessed value.
The assessed data center value is always a function of the market value of the data center. In some cases, like Colorado, there is an explicit assessment ratio for which they take a fraction of the market value of the property as the assessed value.24 But in every case, we need the market value of a data center to calculate the assessed value in order to estimate the property tax revenue from the data center.
The most often used characteristic of a data center to describe its size is not its market value but its peak electrical capacity. The newly proposed data center in Box Elder County is expected to begin as a 1.5 gigawatt (gW) data center, which means it will have a 1.5 gW peak electrical capacity.25 Most current data centers in the US are much smaller than 1.5 gW.
In order to estimate the property tax revenue from a given data center, we need to know its fair market value. To do this, we compiled a list of 22 data centers across the United States for which we could find data on the size of the data center in terms of peak electrical capacity. For 11 of those data centers, we also had data on fair market value. Table 1 and Figure 3 show the data for those 11 data centers, their peak electrical capacity, and their fair market value.
Figure 3. Eleven US data centers by electrical capacity and fair market value
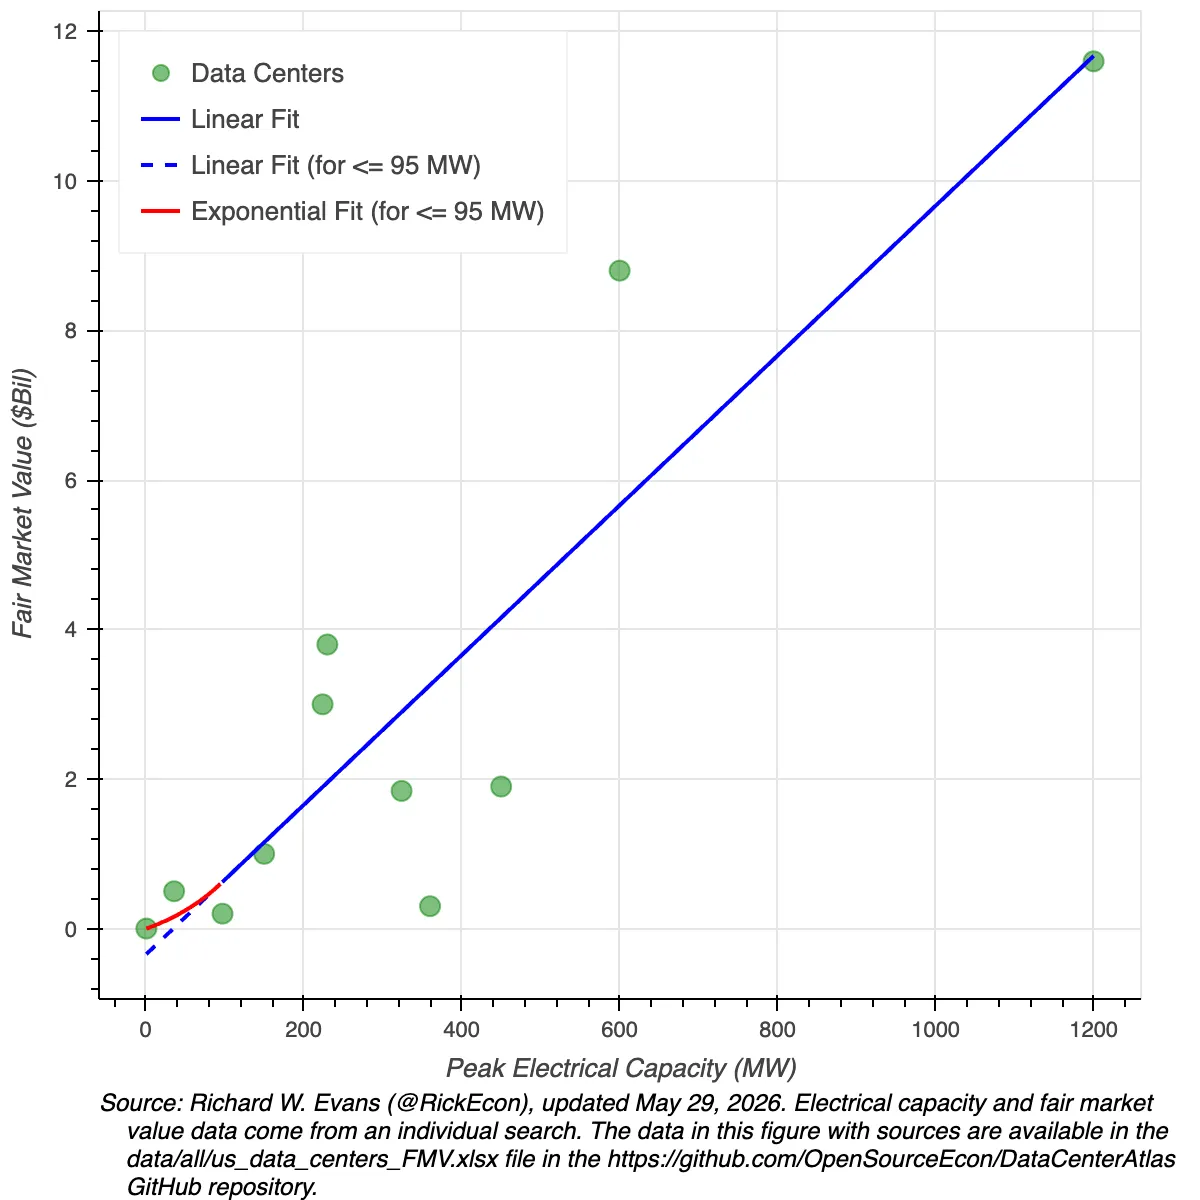
Table 1. Eleven US data centers by electrical capacity and fair market value
| Facility name | Operator | City | County | State | Peak electrical capacity (MW) | Fair market value ($bil) | Status |
|---|---|---|---|---|---|---|---|
| Crusoe Stargate Abilene Campus | Crusoe / OpenAI (campus tenant) / Blue Owl JV | Abilene | Taylor County | TX | 1200.0 | 11.6 | under construction / phased |
| CleanArc Caroline County Campus | CleanArc Data Centers | Caroline County | Caroline County | VA | 600.0 | 8.8 | approved / phased development |
| EdgeCore Mesa Campus | EdgeCore Digital Infrastructure | Mesa | Maricopa County | AZ | 450.0 | 1.9 | expanding / financed |
| NTT Pacific Proving Campus | NTT Global Data Centers | Mesa | Maricopa County | AZ | 360.0 | 0.3 | planned / land acquired |
| Microsoft Project Steamboat | Microsoft / EdgeConneX / TA Realty | Union City | Fulton County | GA | 324.0 | 1.842 | planned / phased |
| Tract Fleet Data Centers | Tract | TRIC / Reno area | Storey County | NV | 230.0 | 3.8 | financed / under development |
| Vantage NV1 Campus | Vantage Data Centers | Reno area | Storey County | NV | 224.0 | 3.0 | planned / pre-leased |
| Skybox Chicago I / Elk Grove Campus | Skybox Datacenters | Elk Grove Village | Cook County | IL | 150.0 | 1.0 | partially operational / campus planned |
| Goodman Innovation Centre San Jose | Goodman Group | San Jose | Santa Clara County | CA | 97.3 | 0.2 | planned / acquired |
| T5@Chicago III | T5 Data Centers | Northlake | Cook County | IL | 36.0 | 0.5 | under construction |
| FirstLight | Antin Infrastructure | Brunswick | Cumberland | ME | 0.9 | 0.0007786 | operational / expandable |
As can be seen from Figure 3, the relationship between peak electrical capacity and fair market value is well approximated by a linear relationship, at least for the ranges of values for which we have data. The estimated values for the blue linear regression line in Figure 3 for electrical capacities greater than 95 MW are the following.
FMVi = 0.010018082083149032 ✕ MWi − 0.3496020387036265
Because the predicted linear regression line predicts negative fair market values for peak electrical capacity less than 34.9 MW, we fit a three-parameter exponential function to all values with peak electrical capacity less than 95 MW.

You can see how we solve for these values in the code fig3tab1_MWtoFMV.py in the open source GitHub repository for this article.26
The function in Figure 3 maps the data center size in peak electrical capacity (MW) into the fair market value of the data center ($ billions). We then calculate the effective tax rate in each county based on the local assessment rules.
We also include a slider for property tax exemption percent. This allows the user to assess how much property tax revenue a county could earn given different levels of tax exemption. We set the default property tax exemption value at 50%, which is roughly representative of what most data centers get. Tax exemption and tax incentives are common for data centers across the US.27
It is important to note that total property tax liability for a given parcel of land is a sum of applicable county and local property tax rates across taxing jurisdictions, such as county rates, municipal rates, special taxing districts such as fire, police, and education.28
In the DataCenterAtlas.org web tool, we average the total effective property tax rate across each county in the states for which we have data. Below are the details for the calculation of average effective property tax rates by county.
Florida. The Florida Department of Revenue publishes an annual “Millage Rates by County” spreadsheet.29 The most recent data are from November 2025. The “Millage Rates” sheet in this spreadsheet is entitled “Millage Rates by County.” It shows the total millage rate for each county as a sum of all the different county, municipal, and special district property tax rates.
The millage rate is the amount of property tax liability for $1,000 of taxable property value. So a total millage rate of 15.4115 for Holmes County, Florida represents an average effective 0.0154115 (or 1.54%) property tax rate. The Florida county property tax rates we use in the DataCenterAtlas.org tool are the total millage rates by county, divided by 1,000.
Florida taxes commercial properties, including data centers, and 100% of their fair market value, including tangible personal property. Residential property is also taxed at 100% of fair market value, but commercial properties are assessed much more aggressively than residential properties.30
Maine. The Department of Administrative and Financial Services at the Maine Revenue Services publishes “Full value tax rates for years 2013-2024” in an Excel spreadsheet.31 These property tax rates are equalized or effective tax rates calculated by dividing the 2024 Municipal commitment by the 2026 state valuations. The tax rates are also adjusted to account for homestead exemptions, business and equipment tax exemption (BETE) and tax increment financing (TIF) adjustments.
The BETE exemption and Dirigo Business Incentive Program were recently removed from data center property tax liability calculation by LD 713 in Maine, which increases the effective property tax burden on data centers in Maine.32 This recent change is not reflected in the 2024 average tax rates by county. So a user could capture this by decreasing the default property tax exemption slider in the DataCenterAtlas.org web tool. Before this change, Maine commercial businesses, including data centers, were assessed at 100% of their fair market value, minus the BETE exemption. Now data centers are assessed at 100% of their fair market value including the value of their business personal property.
North Carolina. In North Carolina, commercial properties and data centers are assessed at 100% of the value of the land, buildings, site improvements, and business personal property after application of depreciation schedules. The North Carolina Department of Revenue publishes the 2025-2026 County and Municipal Tax Rates and Effective Tax Rates, which combines the county and municipal effective tax rates for each municipality in each county for the fiscal year 2025-2026.33 We then calculate the county average tax rate as the equally weighted average of each municipality’s statutory combined property tax rate within the county. We use the statutory rate instead of the effective rate because most of the reductions in effective rate from the statutory rate likely come from residential properties and not commercial properties.
Some municipalities in the North Carolina tax data showed no municipal property tax rate in which cases the combined property tax rate would default to “None”. We changed this to be the county property tax rate rather than “None”.34
A better approach would be to have weight values for each municipality in calculating the county average tax rate. But we could not find any good weights for each tax area. The ideal weighting data to get more accurate county averages would be total property tax revenue per municipality.
North Carolina offers major sales-and-use tax exemptions for qualifying data centers, but not broad statewide property tax exemptions comparable to those found in states such as Virginia. Qualifying North Carolina data centers can receive exemptions on electricity and certain equipment purchases if investment and employment requirements are met.35
Utah. The Utah State Tax Commission (USTC) publishes annual tax rates by area.36 This document for 2025 (taxarearates2025.pdf) shows the final adopted property tax rate for each tax area within each county as the sum of county, municipal, and special district property tax rates. We then calculate the county average tax rate as the equally weighted average of each tax area total tax rate within the county.
A better approach would be to have weight values for each tax area in calculating the county average tax rate. But we could not find any good weights for each tax area. The ideal weighting data to get more accurate county averages would be total property tax revenue per tax area.
We have posted our CSV file summary of the USTC PDF, as well as a summary .csv file of that document (data/UT/rates_ut_2025.csv), a more highly summarized data file of average Utah 2025 property tax rates by county (data/UT/avg_proptax_rate_by_cnty_ut_2025.csv) and the code that created it (code/UT/ut_analyses.py) in the open source GitHub repository for this article (https://github.com/OpenSourceEcon/DataCenterAtlas).
In Utah, commercial properties and data centers are assessed at 100% of the value of the land, buildings, site improvements, and business personal property after application of depreciation schedules. This is in contrast to residential properties which are assessed at 55% of market value, a 45% residential property tax exemption.37